Tidewater
Three years of tide-gauge readings, read closely — a small research project on how one harbour breathes, and how to show it to people who are not oceanographers.
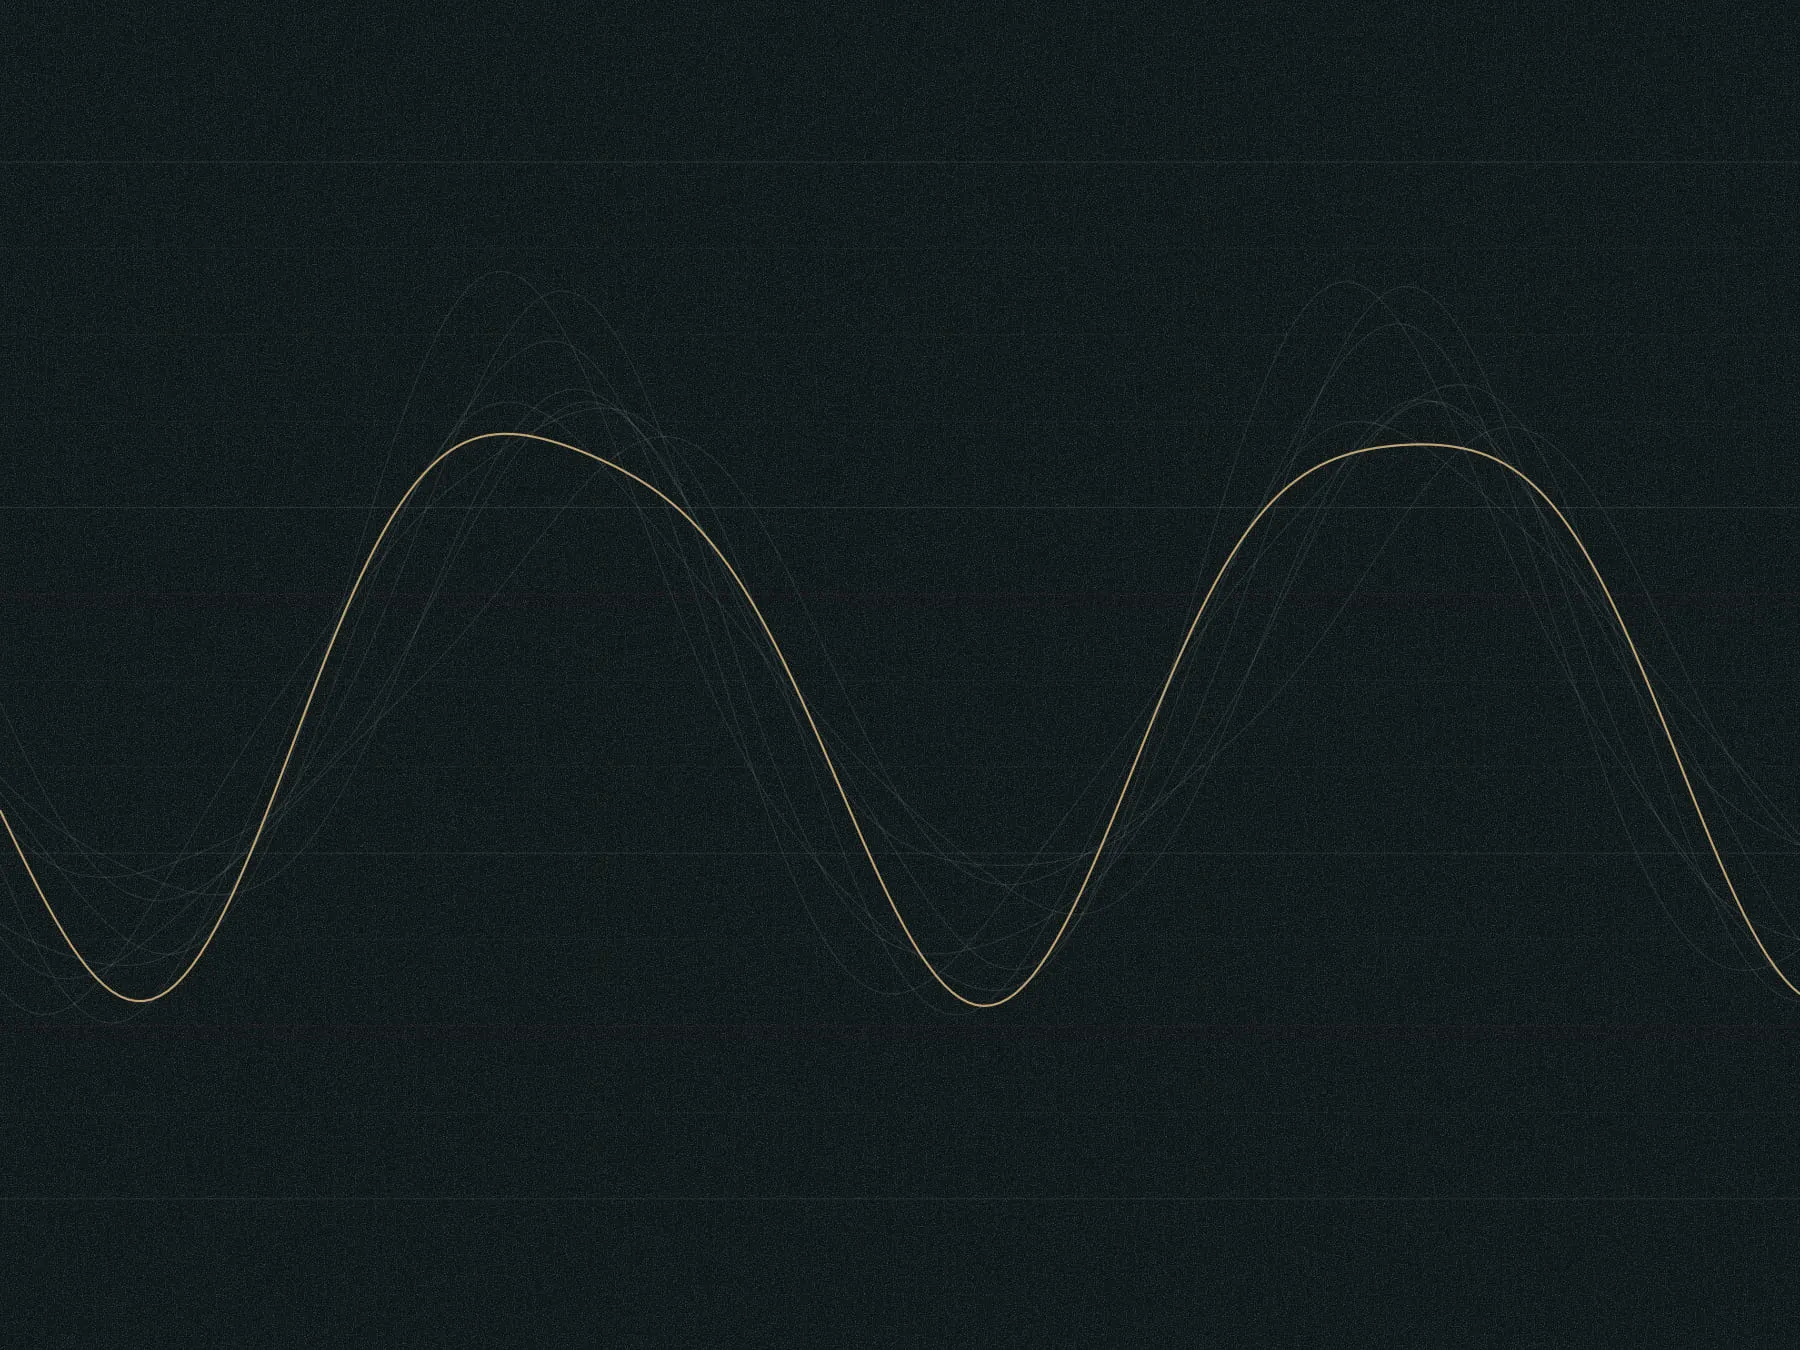
A harbour fills and empties twice a day, but never quite the same way twice. Tidewater is an attempt to make that rhythm visible — first for myself, then for anyone who has stood on a pier and wondered why the water is higher than yesterday.
Method
Readings every six minutes for three years, cleaned of sensor dropouts and storm surges, then decomposed into their tidal constituents. The result is a set of charts you can read like a score.
What it showed
The spring–neap cycle is obvious. Less obvious: a slow seasonal swell, and a small but steady rise across the three years.